

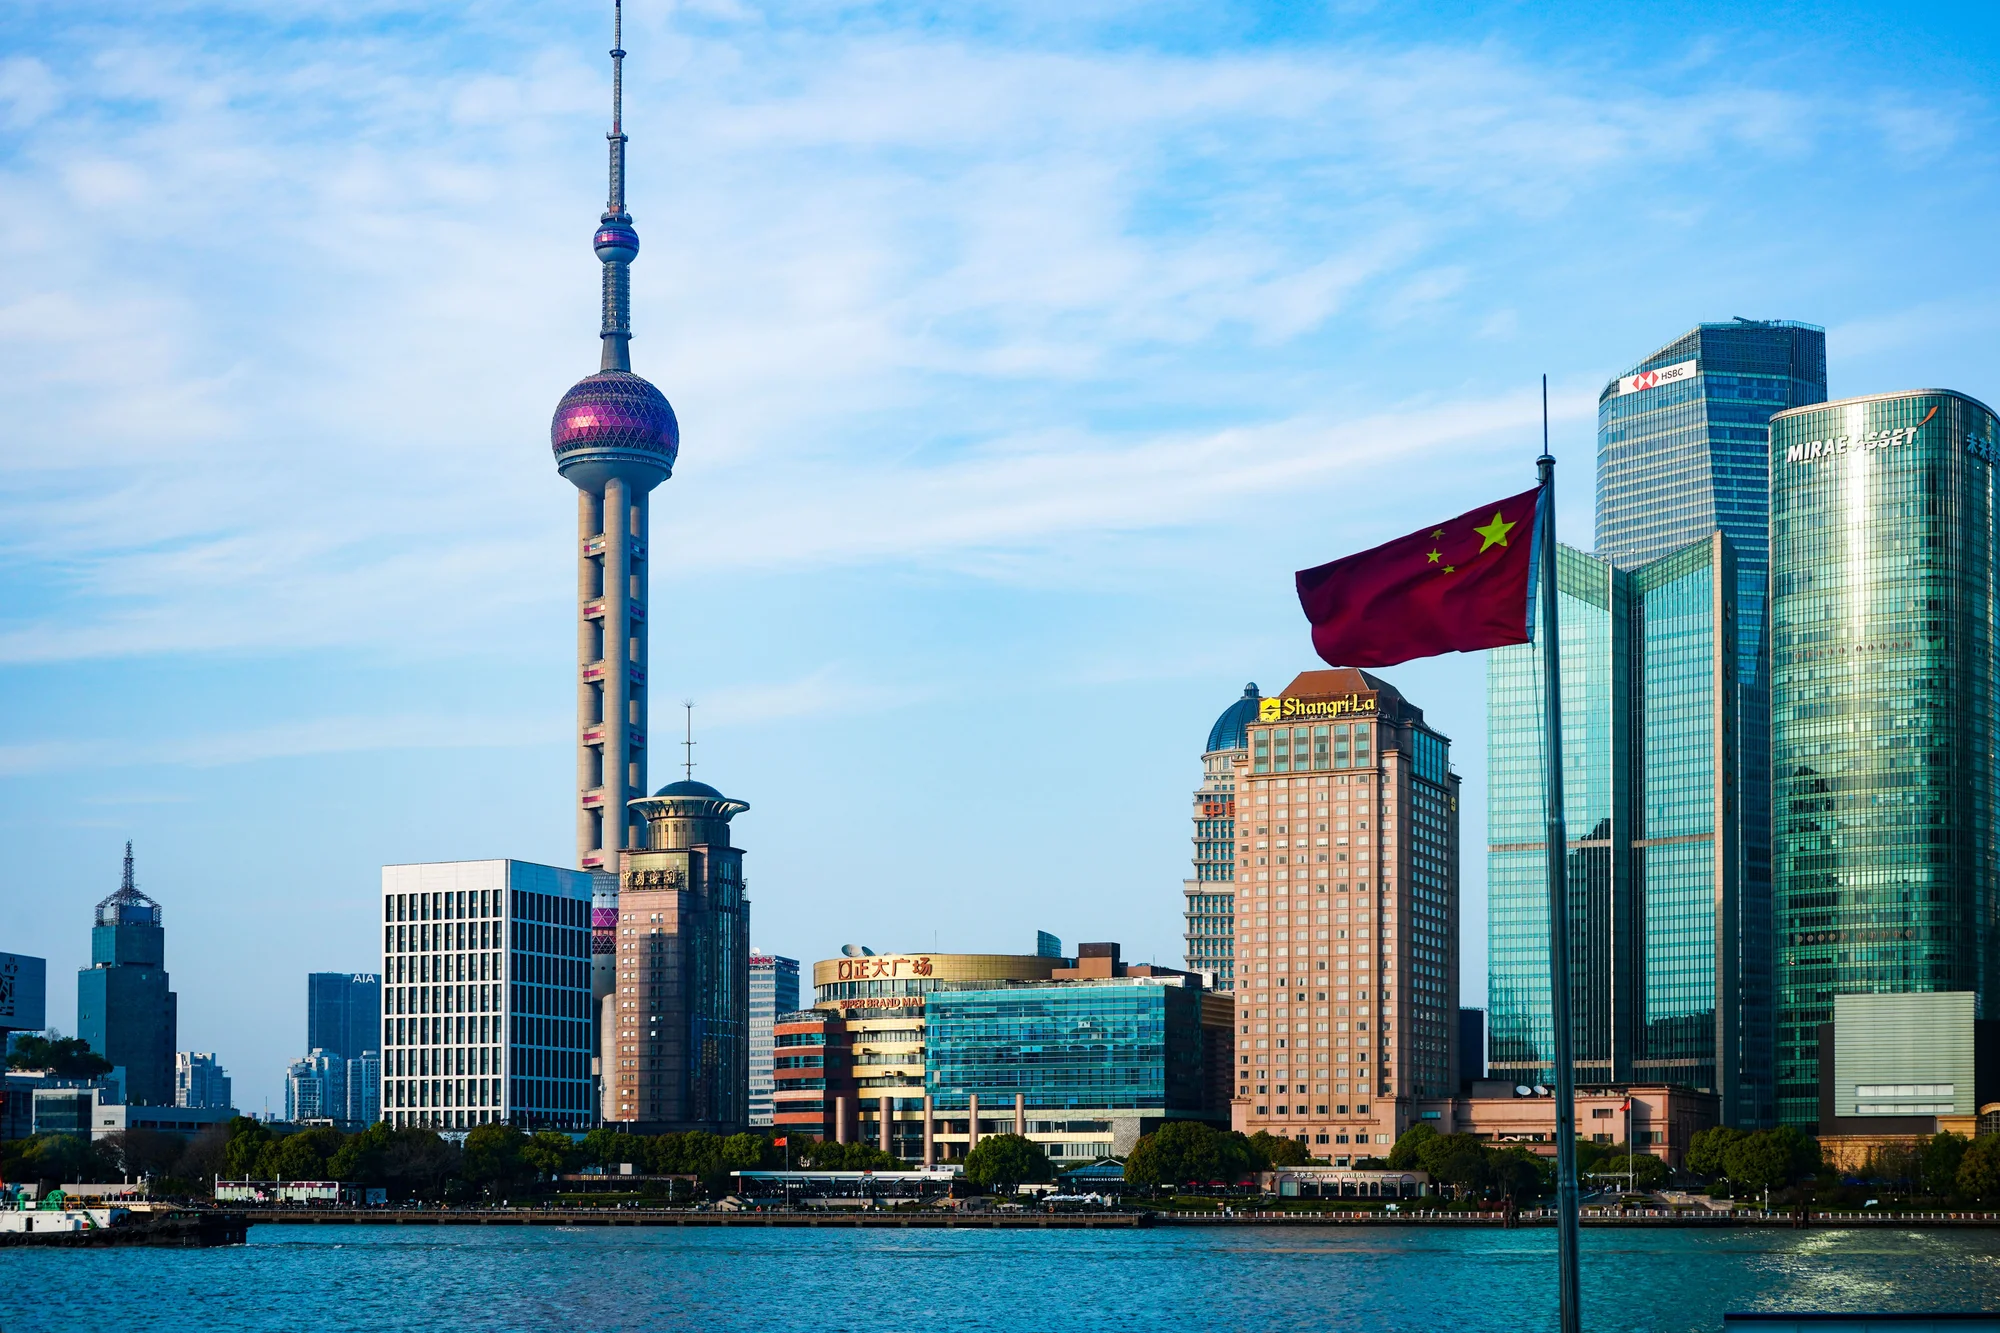
The physical center of gravity in the global exhibition industry is shifting. Europe has long been one of the sector’s strongest infrastructure hubs, supported by major exhibition cities such as Frankfurt, Hanover, Milan, Paris, and Barcelona. But rapid investment across Asia-Pacific in recent years has pushed the regional balance in a new direction. According to the 2026 World Map of Exhibition Venues, published by the Global Association of the Exhibition Industry UFI and prepared by jwc, Asia-Pacific now has the highest number of mega-scale exhibition venues in the world. The number of facilities offering at least 100,000 square meters of gross indoor exhibition space has risen to 41 in the region, compared with 38 in Europe. In the previous report, the two regions were tied at 38 venues each.
The difference is not limited to the number of very large facilities. Asia-Pacific is also extending its global lead in total indoor exhibition space. The region’s total capacity has reached 17.3 million square meters, representing 38.3 percent of global exhibition space. Europe accounts for 35.8 percent, while North America holds 16.7 percent. Exhibition infrastructure worldwide is also continuing to expand. By the end of 2025, there were 1,565 venues offering at least 5,000 square meters of indoor exhibition space, with a combined capacity of 45.2 million square meters. Compared with the previous study, the global system added 35 new venues and around 900,000 square meters of additional space.
The figures show that the capacity race in the exhibition industry is about more than simply building larger halls. Major exhibition venues are becoming long-term economic infrastructure, allowing international organizers to bring tens of thousands of participants into one destination, stage large-scale product displays, and bring growing industries together under one roof.
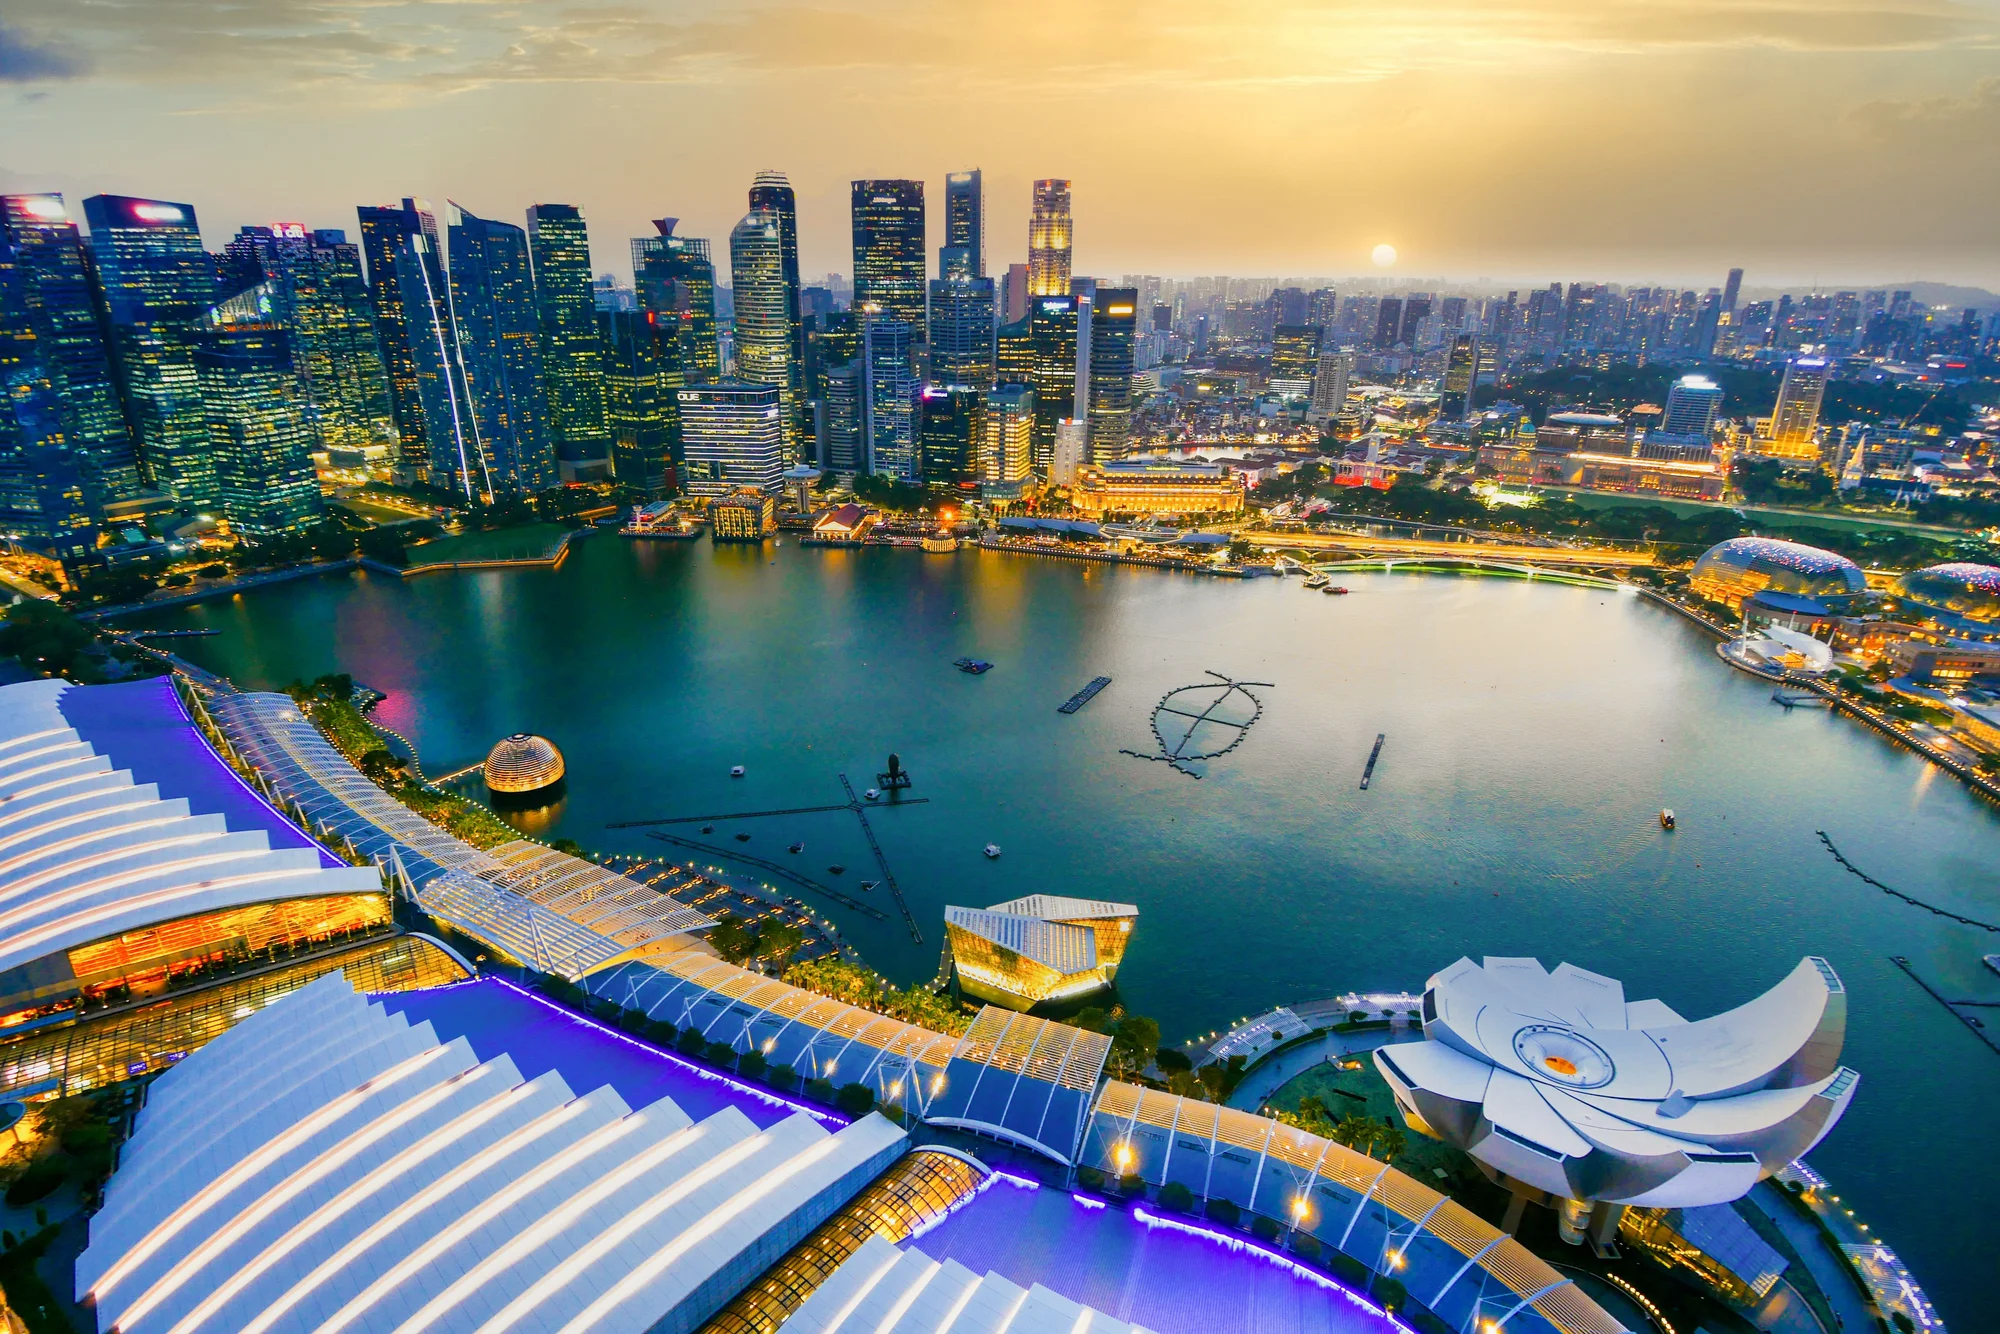
Exhibition Venues Are Larger in Asia-Pacific
The difference between regions is also visible in the average size of individual venues. Exhibition centers included in the study average 39,238 square meters of indoor space in Asia-Pacific, compared with 29,802 square meters in Europe. The gap illustrates the scale of newer exhibition investments across Asia. In China in particular, major complexes are no longer designed simply as collections of exhibition halls, but as large campuses combining conference spaces, logistics areas, food and beverage infrastructure, and facilities capable of supporting multiple events at the same time.
Worldwide, only 84 venues offer 100,000 square meters or more of indoor exhibition space. Although these facilities represent only around 5 percent of the total number of venues, they provide the infrastructure that directly determines which cities can host the largest international exhibitions. Most of the global exhibition market still consists of smaller facilities, with 62 percent of venues offering less than 20,000 square meters and 33 percent providing between 20,000 and 100,000 square meters of indoor space.
China Alone Holds 30.7 Percent of Global Capacity
China sits at the center of Asia-Pacific’s growth. The country alone accounts for 30.7 percent of the world’s total indoor exhibition space. The United States follows with 13.9 percent, while Germany holds 7 percent. When Italy and France are added, the world’s five largest exhibition markets control around 63 percent of global capacity. Only seven countries worldwide have more than one million square meters of total exhibition space.

One of the clearest examples of China’s scale is the Canton Fair Complex in Guangzhou. With around 504,000 square meters of indoor exhibition space, it remains the world’s largest exhibition venue. That capacity also shows how closely exhibitions are tied to the country’s wider economic infrastructure, particularly in manufacturing and export-oriented industries. From automotive and electronics to industrial equipment and consumer goods, large-scale exhibitions can accommodate more exhibitors and visitors at the same time.
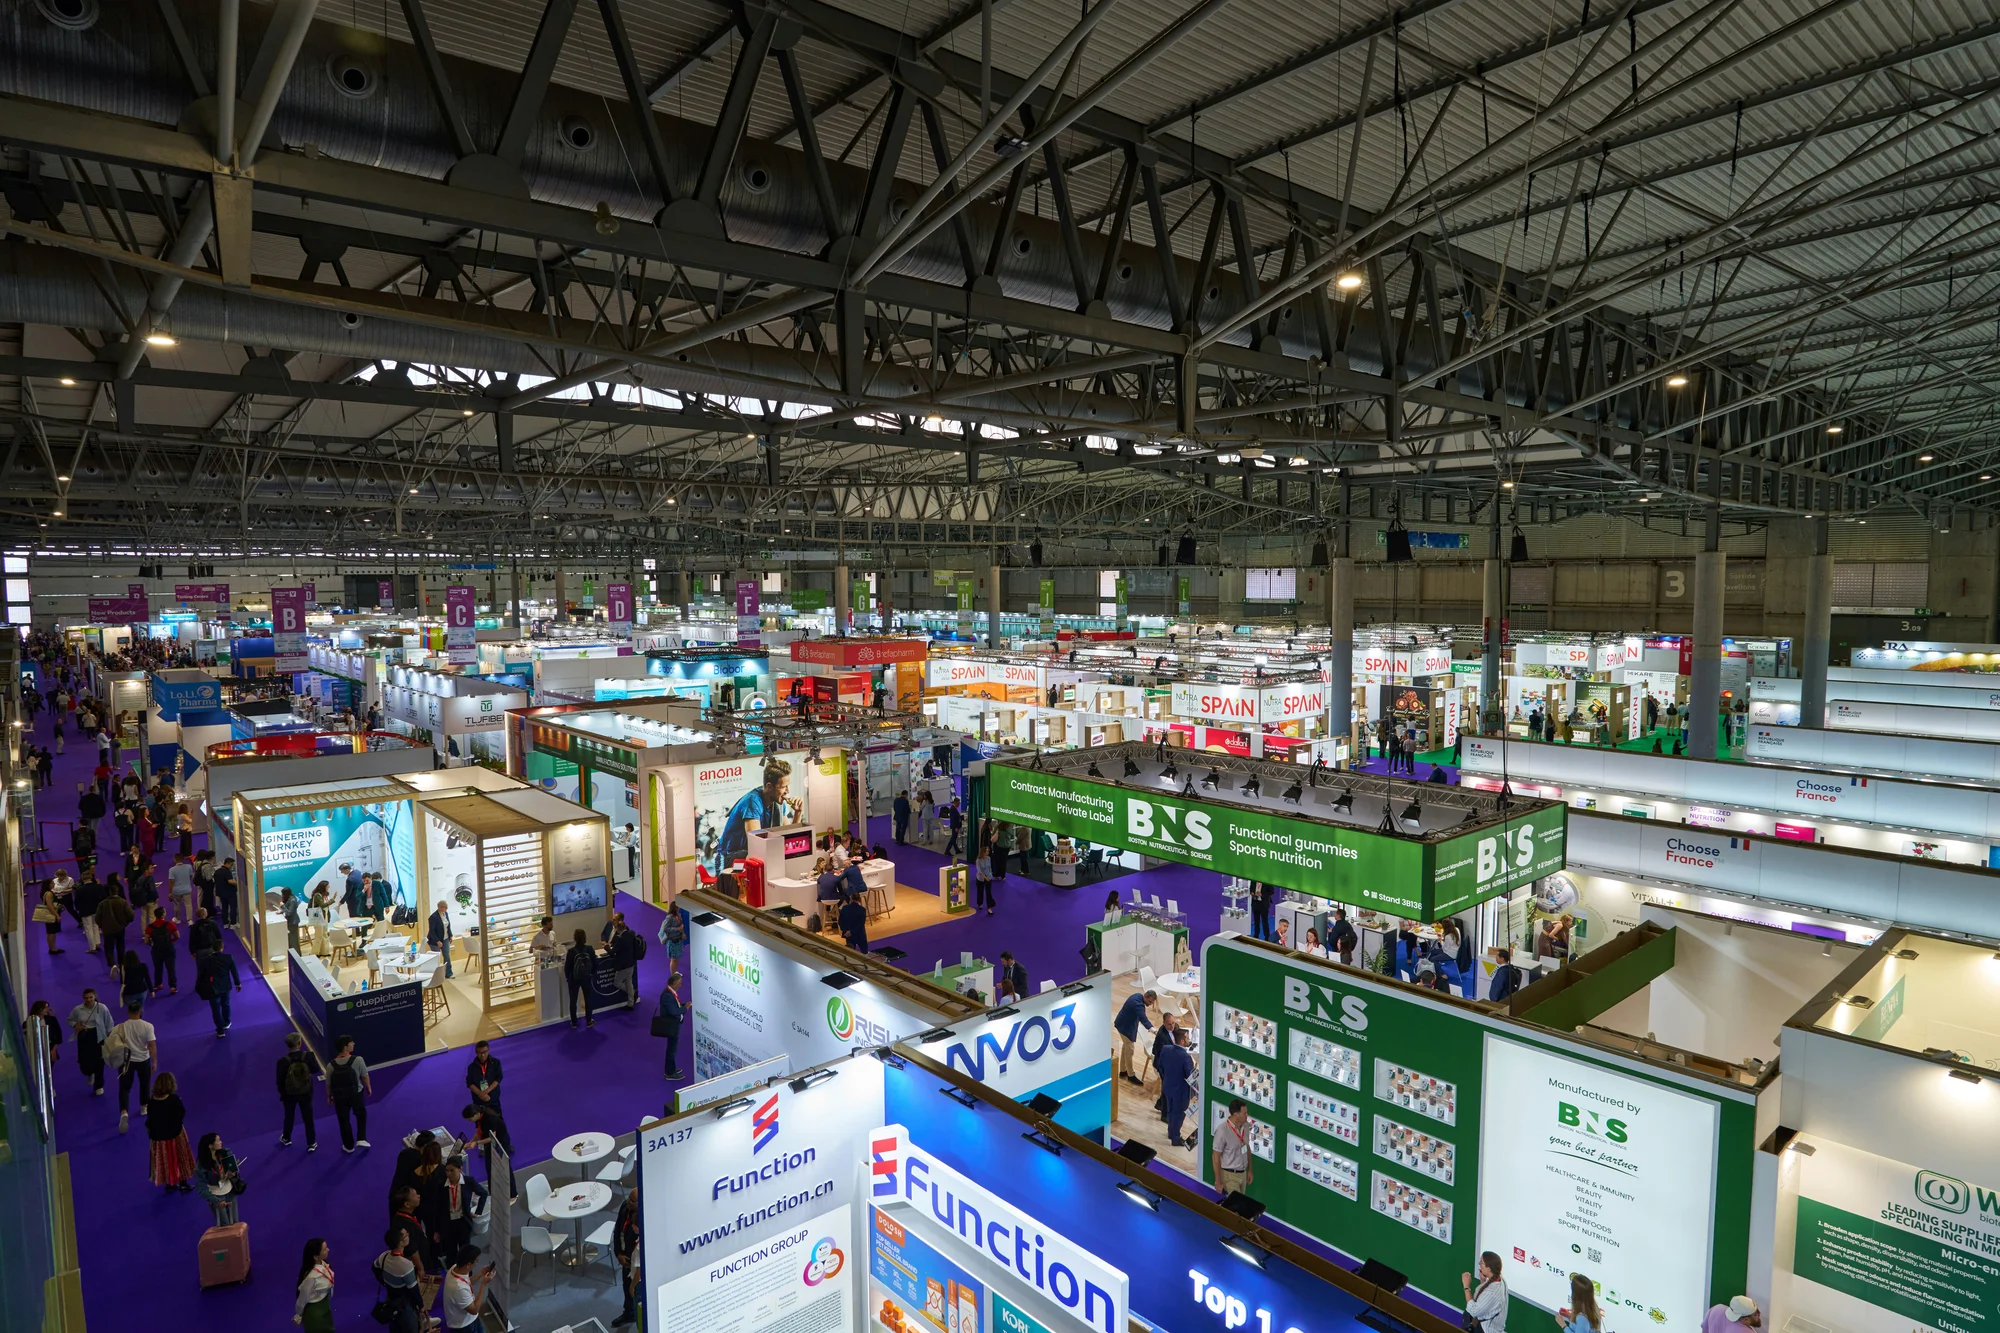
Europe Remains Strong, but the Gap Is Widening
Asia-Pacific moving into first place in mega exhibition venues does not mean Europe is losing its importance in the global exhibition industry. Europe still accounts for 35.8 percent of total indoor exhibition space worldwide. Countries such as Germany, Italy, France, and Spain remain among the sector’s strongest markets in terms of both physical capacity and long-established international exhibition brands.
However, the pace of new infrastructure investment is changing the regional balance. Asia-Pacific’s share of global capacity has reached 38.3 percent, creating a 2.5 percentage point gap over Europe. This shift could also influence how organizers approach future growth. Visitor demand alone is not enough for a major exhibition to expand into a new market. Destinations also need the physical infrastructure to support thousands of exhibitors, complex logistics operations, and tens of thousands of visitors. Rising capacity across Asia-Pacific therefore creates more room not only for new exhibitions, but also for existing international events to launch additional editions in the region.

The Middle East, Africa and Latin America Are Also Gaining Ground
Central and South America account for 4.8 percent of global exhibition capacity, while the Middle East and Africa together have reached a 4.5 percent share. The combined share of the two regions increased from 8.4 percent to 9.3 percent in a single year. Their physical capacity has not yet reached the scale of Europe or Asia-Pacific. Central and South America also remains the only region without an exhibition venue exceeding 100,000 square meters.
The Middle East, however, is adding new capacity through continued investment in exhibition and convention infrastructure. Combined with airport, hotel, and transport development across the region, new exhibition venues are increasingly being developed as part of broader destination strategies.